Stop managing your business blindly

Turn monthly financial data into clear business decisions

The MetricMitra Monthly MIS Dashboard transforms routine Excel data into clear profitability, cash-flow, receivables, payables and performance insights—without building complicated reports from scratch.

  • ✓No advanced Excel knowledge required
  • ✓One-time payment
  • ✓Instant Excel download

One-time payment • No subscription • Immediate download

⭐ Developed by a Chartered Accountant for practical business reporting

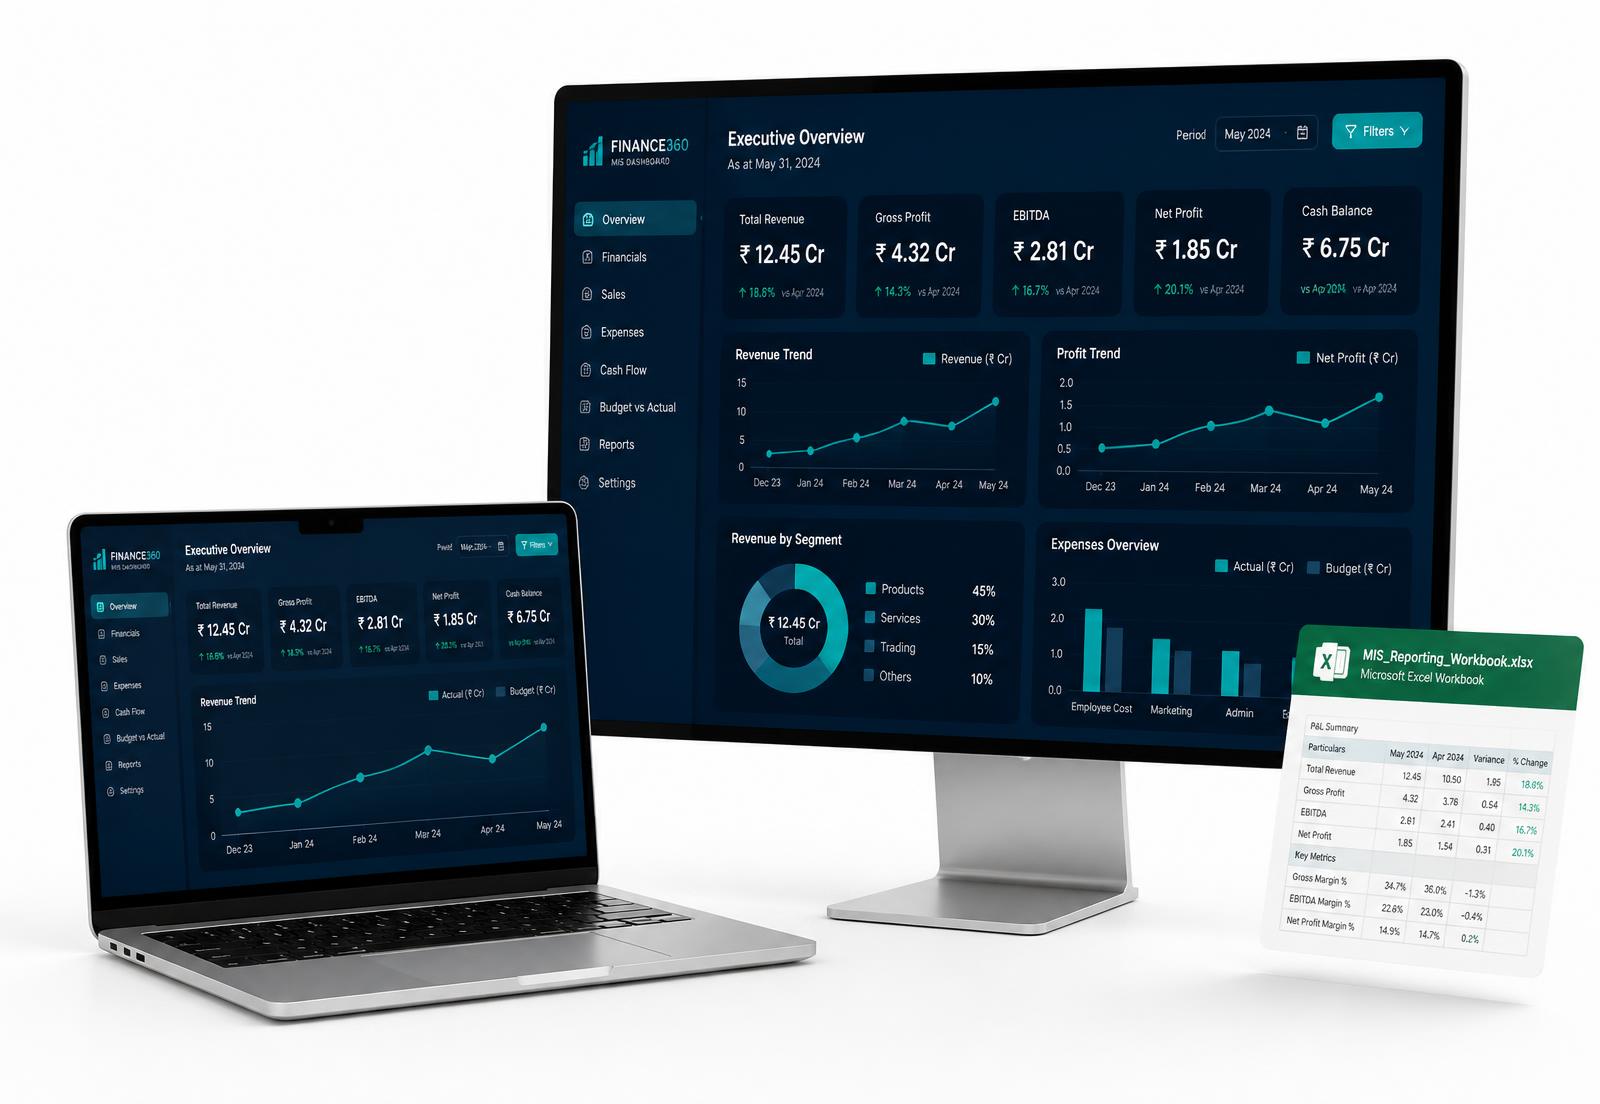
MetricMitra Monthly MIS Dashboard shown on a desktop monitor and laptop with an Excel workbook preview

The problem

Your financial data exists. But is it helping you decide?

You may already maintain sales, expenses, customer balances and vendor payments in Excel. Yet answering basic management questions can still take too long.

  • ?Is the business genuinely profitable?
  • ?Why is cash reducing despite healthy sales?
  • ?Which customers have overdue balances?
  • ?What payments are becoming due?
  • ?Are margins improving or declining?
  • ?What should management focus on this month?

When financial information remains scattered across separate sheets, important warning signs can easily be missed.

Stop spending hours turning data into reports

Preparing an MIS from scratch requires formulas, formatting, charts and repeated checking every month. A small error can distort the entire management report.

The MetricMitra dashboard gives you a structured starting point, so you can focus on understanding the numbers instead of designing the report.

Product showcase

One workbook. A clearer view of your business.

The Monthly MIS Dashboard brings important financial information together in a professional, management-friendly format. Explore the actual dashboard sections below.

Reporting month: Dec 2026 · illustrative data

Revenue

₹15.62 L

+2.8% vs Nov

Gross profit

₹8.33 L

53.3% margin

EBITDA

₹4.05 L

25.9% margin

Net profit

₹3.38 L

21.6% margin

Closing cash

₹37.55 L

Revenue & net profit trend

Working capital snapshot

Receivables

₹12.42 L

Receivable days

28.4

Payables

₹12.42 L

Payable days

60.5

See exactly what you're buying

Explore the dashboard, its financial summaries, ageing reports and trend charts before purchasing. No exaggerated claims—just a practical finance tool built to make monthly reporting easier. Figures shown are illustrative sample data included with the workbook.

Key features

Everything needed for a practical monthly review

01

Management KPI dashboard

View important performance indicators from one central screen.

02

Monthly profit & loss

Understand revenue, expenses, gross profit and net profit without manually preparing a separate summary.

03

Cash-flow tracking

Monitor operating cash movement and closing cash position across periods.

04

Receivables ageing

Identify outstanding and overdue customer balances requiring follow-up.

05

Payables ageing

Understand upcoming and overdue vendor obligations before planning payments.

06

Financial trend charts

Compare monthly movements in revenue, profitability, cash and balances.

07

Reporting-month selector

Select the required month and review the corresponding information.

08

Built-in validation checks

Identify inconsistencies before presenting the report to management.

Benefits

More than an Excel file—a better reporting system

Save time every month

Start with an organised MIS structure instead of repeatedly preparing reports, formulas and charts from scratch.

Explain performance clearly

Convert accounting information into summaries that business owners and non-finance managers can understand.

Make better financial decisions

Spot profit trends, cash pressure, delayed collections and payment obligations before they become larger problems.

Who is this for?

The Monthly MIS Dashboard is designed for:

Small-business ownersMSMEs and growing startupsChartered AccountantsAccountants and finance executivesFreelance CFOsFinance consultantsBookkeepers and MIS professionalsCommerce and finance professionals

This product is especially useful if:

  • ✓You prepare monthly reports manually
  • ✓You manage information across multiple Excel files
  • ✓You want to present better MIS reports to clients
  • ✓You need greater visibility over cash and profitability
  • ✓You want an affordable reporting solution without monthly software fees

Value comparison

How it compares

FeatureManual MISGeneric templateMetricMitra
Ready-to-use structureNoSometimesYes
P&L dashboardManualLimitedIncluded
Cash-flow trackingManualOften absentIncluded
Receivables ageingSeparate workingLimitedIncluded
Payables ageingSeparate workingLimitedIncluded
Trend chartsManualBasicIncluded
Validation checksManualOften absentIncluded
Sample data and instructionsNoVariesIncluded
Monthly subscriptionNoVariesNo
One-time priceTime-intensiveVaries₹399 launch price

Creator credibility

Built from practical finance experience

MetricMitra was created by CA Akshay Rao T, a Chartered Accountant with experience in financial reporting, MIS, taxation, reconciliations and ERP-based finance operations.

The dashboard is designed around a practical requirement: helping finance professionals and business owners convert routine accounting data into information that supports decisions.

Pricing

Get the complete Monthly MIS Dashboard

₹399₹499Launch price

You receive:

  • ✓Monthly MIS Dashboard
  • ✓Profit & loss summary
  • ✓Cash-flow statement
  • ✓Receivables ageing
  • ✓Payables ageing
  • ✓Financial KPI calculations
  • ✓Monthly trend charts
  • ✓Illustrative sample data
  • ✓Quick-start instruction sheet
  • ✓Built-in validation checks
Payment
One-time
Subscription
None
Delivery
Instant Excel download
Access
Lifetime, purchased version

Secure payment • Instant download • No recurring charges

7-day access guarantee

If you cannot access or download the Monthly MIS Dashboard after payment, contact support within seven days. We will help restore access or provide the file. If the access issue cannot be resolved, you can request a full refund.

Read the full Refund Policy

Included free with your purchase

Quick-start guide

Where to enter data, how to select the reporting month and how to review the dashboard.

Illustrative sample data

Explore a completed example before replacing it with your own business information.

Monthly MIS review checklist

A structured checklist to follow before sharing the report with management or clients.

Free setup support is available for the first 20 launch customers.

FAQ

Frequently asked questions

Also from MetricMitra

Another practical resource for finance professionals

Ebook • Version 1.0

Practical ITR Filing Master Guide

A workflow-based income tax return guide for CA students, junior accountants and tax practitioners: ITR-1 to ITR-4 in depth, essential ITR-5 to ITR-7 topics, Winman and Income Tax Portal filing workflows, case studies, plus working paper formats and checklists in the guide.

₹699indicative price

Sold separately from the Monthly MIS Dashboard. Not yet on sale — enquire about availability.

Your numbers should guide you—not confuse you

Stop spending valuable time assembling scattered financial information every month. Review profitability, cash flow, receivables, payables and business trends from one organised Excel workbook.

One-time payment • Instant Excel download • No subscription

Monthly MIS Dashboard — Launch price ₹399